
Essay · Essays
PISA 2025 Spain: AI and digital distraction, with data
I analysed the PISA 2025 microdata for Spain: digital distraction in class is associated with lower scores; AI chatbot use doesn't follow a simple pattern.
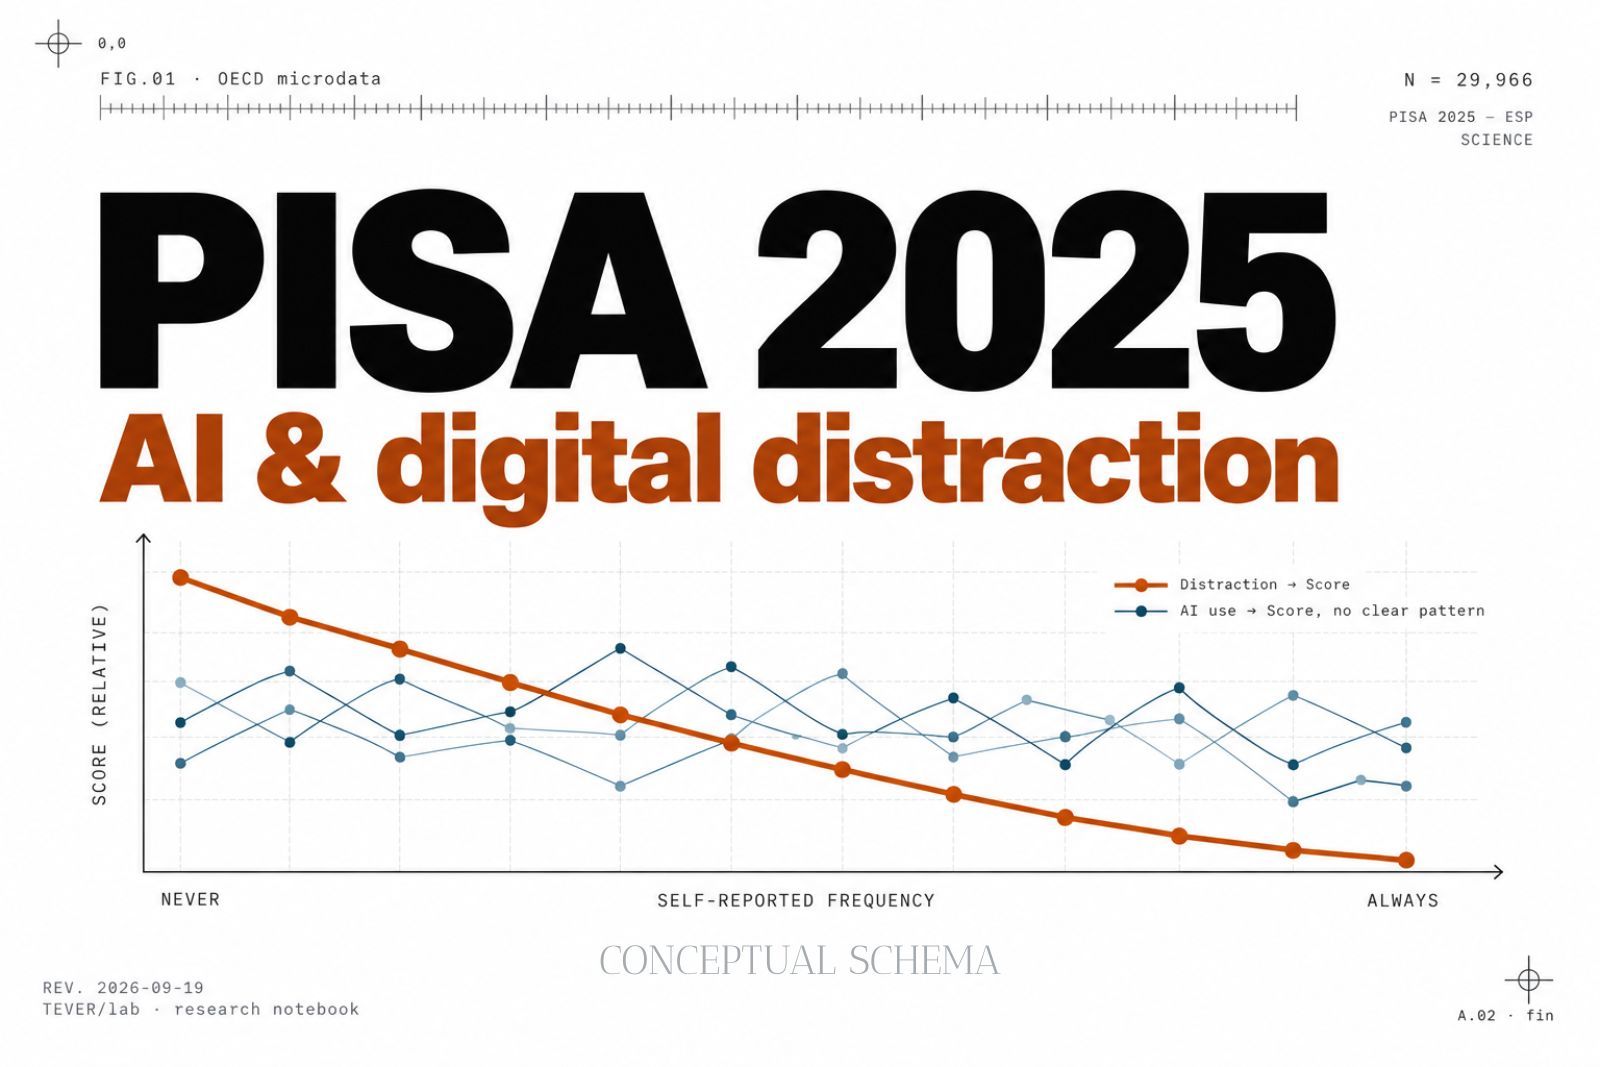
PISA is an OECD international assessment that studies the extent to which 15-year-old students can apply knowledge and skills in Reading, Mathematics and Science: every three years, the OECD tests 15-year-old students from dozens of countries, and alongside the test gives them a questionnaire about their classroom climate and habits —among them, how much distraction from digital resources they perceive in their Science class, and how much they use AI chatbots like ChatGPT for schoolwork. The 2025 edition, with results published in September 2026, is the first to ask about the use of these chatbots.
Every few months a figure circulates that promises to settle the debate over AI in the classroom: that using it “well” is equivalent to gaining a full school year. I’ve seen it cited without the exact source more times than I can count. Before repeating it, I wanted to check what the microdata say, not the headline. So I downloaded the individual, anonymous responses from the 29,966 Spanish records in the PUF that I analysed. The whole process is repeatable by anyone with the original data and the notebook I link at the end of the article.
This isn’t a piece about a third-party tool, like the technical audits I’ve already done in this notebook with openDAW or RACK-02. It’s the same attitude —open the box, verify with my own hands instead of trusting someone else’s summary— applied to a public scientific dataset instead of a software product.
Why analyse the microdata, not just the report
The OECD publishes its own PISA reports, with charts and conclusions already worked out. The official reports answer specific questions through analytical decisions that are already fixed; working with the microdata as well makes it possible to ask other questions and reproduce the analysis. PISA also publishes that microdata: each student’s response, unidentified, already prepared, coded and documented by the OECD itself —not a raw dump— in a file called the Public Use File (PUF) that anyone can download and analyse on their own. That’s what I did, with the student file that the OECD itself hosts in its PISA database (direct download of the exact file I used, SPSS format, ~1 GB). PISA has its own entry in this notebook, at /concepto/pisa.
Working with the original data allows for two things a ready-made report doesn’t: choosing exactly what to compare (in this case, AI chatbot use for schoolwork and perceived distraction from digital resources in class, against the Science score) and checking claims that circulate about PISA myself before repeating them without question.
A curiosity from the download process itself, for honesty about the data:
the URL contains /pisa2022/, even though the file corresponds to the 2025
cycle. I confirmed the content is genuinely from the 2025 edition by looking
inside the file itself: it carries an internal marker that says “2025”,
includes questions about ChatGPT that didn’t exist in 2022, and comes with a
data block exclusive to this edition that doesn’t exist in previous ones.
What I compared and how
The starting question is simple: among Spanish students, do those who perceive more distraction from digital resources in their class score worse in Science? And those who use AI chatbots more for schoolwork? And if the answer is yes in either case, does it hold once I account for the fact that a family’s economic and cultural level is already strongly associated with performance, so as not to confuse one thing with the other?
What I used from the questionnaire, with its 29,966 responses from Spain:
- How much distraction from digital resources they perceive in their Science class. The exact item asks how often “students are distracted using digital devices (e.g. phones, websites, apps)” in that class — it’s a question about the general climate of the classroom, not a self-report of “I get distracted”, and it isn’t limited to phones: the phone is just one of the examples the question gives in parentheses. Four possible answers, from “every class” to “never or almost never”.
- How much they use AI chatbots like ChatGPT, for four different schoolwork tasks: summarising a text, looking up information on a topic, drafting a piece of writing, or “helping me learn” in general — each with its own frequency, from “never” to “daily”. The question is specific to conversational chatbots for schoolwork (it doesn’t cover other kinds of generative AI, like image generators) and it isn’t limited to the classroom: it can be use at home, doing homework. I analyse the purposes separately because they represent different uses, and there’s no reason to assume they hold the same relationship with performance.
- The Science score. A technical nuance here that I’d rather state than hide: PISA doesn’t aim to estimate a precise score for each individual student. For population-level inference it provides ten plausible values of performance; the analysis has to be repeated with all ten and the results combined afterwards.
- The family’s economic and cultural status (ESCS), to be able to adjust for it and not confuse “uses the chatbot a lot” with “comes from a family with more resources”, which is already associated with better scores on its own. This index combines three things: parents’ educational level, their occupational status, and household possessions/resources.
- The weight of each response. Not every student counts equally in the calculation: each one carries a correction factor to estimate results for the target population according to PISA’s sampling design, not just for whoever answered the survey.
With that data I calculated the mean Science score for each group (for instance, “those who use the chatbot daily for summarising texts”): I calculated weighted means and their 95% confidence intervals, combining the ten plausible values and the 80 BRR-Fay replicate weights, first without touching anything else and then adjusting for the family’s economic-cultural status. The script I wrote to download and analyse the file is public, and anyone can reproduce the exact calculation on the OECD’s official file.
A caveat about the Spanish sample that’s worth keeping in mind while reading everything that follows: Spain’s student exclusion rate in this edition was 7.9%, above the 5% technical standard set by PISA, with especially marked increases in Catalonia (from 5.6% to 23.2%) and Murcia (from 4.1% to 12.7%). The OECD’s own official country note (see references) states it plainly: “The high levels of student exclusions are very likely to result in an upward bias.” The data is still considered comparable, but it’s worth reading the figures that follow with that nuance in mind.
The result: two very different patterns
Distraction really is a clear pattern: more perceived distraction, lower scores
The estimated mean Science score decreases monotonically as the frequency of perceived distraction from digital resources that students report observing in their class increases, with no exception across the four groups. Put more directly: the more distraction they perceive, the lower they score on average.
- Perceive distraction in every class — mean score: 457.3 (461.5 adjusted for ESCS)
- Never or almost never perceive it — mean score: 489.5 (491.0 adjusted for ESCS)
Nearly 32 points of difference between the group that perceives the most distraction and the one that perceives the least, in the raw estimate. Adjusting for the family’s economic-cultural status narrows the gap somewhat, but doesn’t make it disappear: the pattern holds just as clearly with and without that adjustment. An honest nuance about that adjustment: the adjusted sample excludes roughly 1.4% of students with no ESCS data, so the difference between the raw and adjusted curves combines the real statistical adjustment with that change in sample. For distraction, in fact, most of that shift comes from excluding those cases, not from the adjustment itself — with the additional nuance that what this question measures is students’ perception of their classroom climate, not how much any individual student gets distracted.
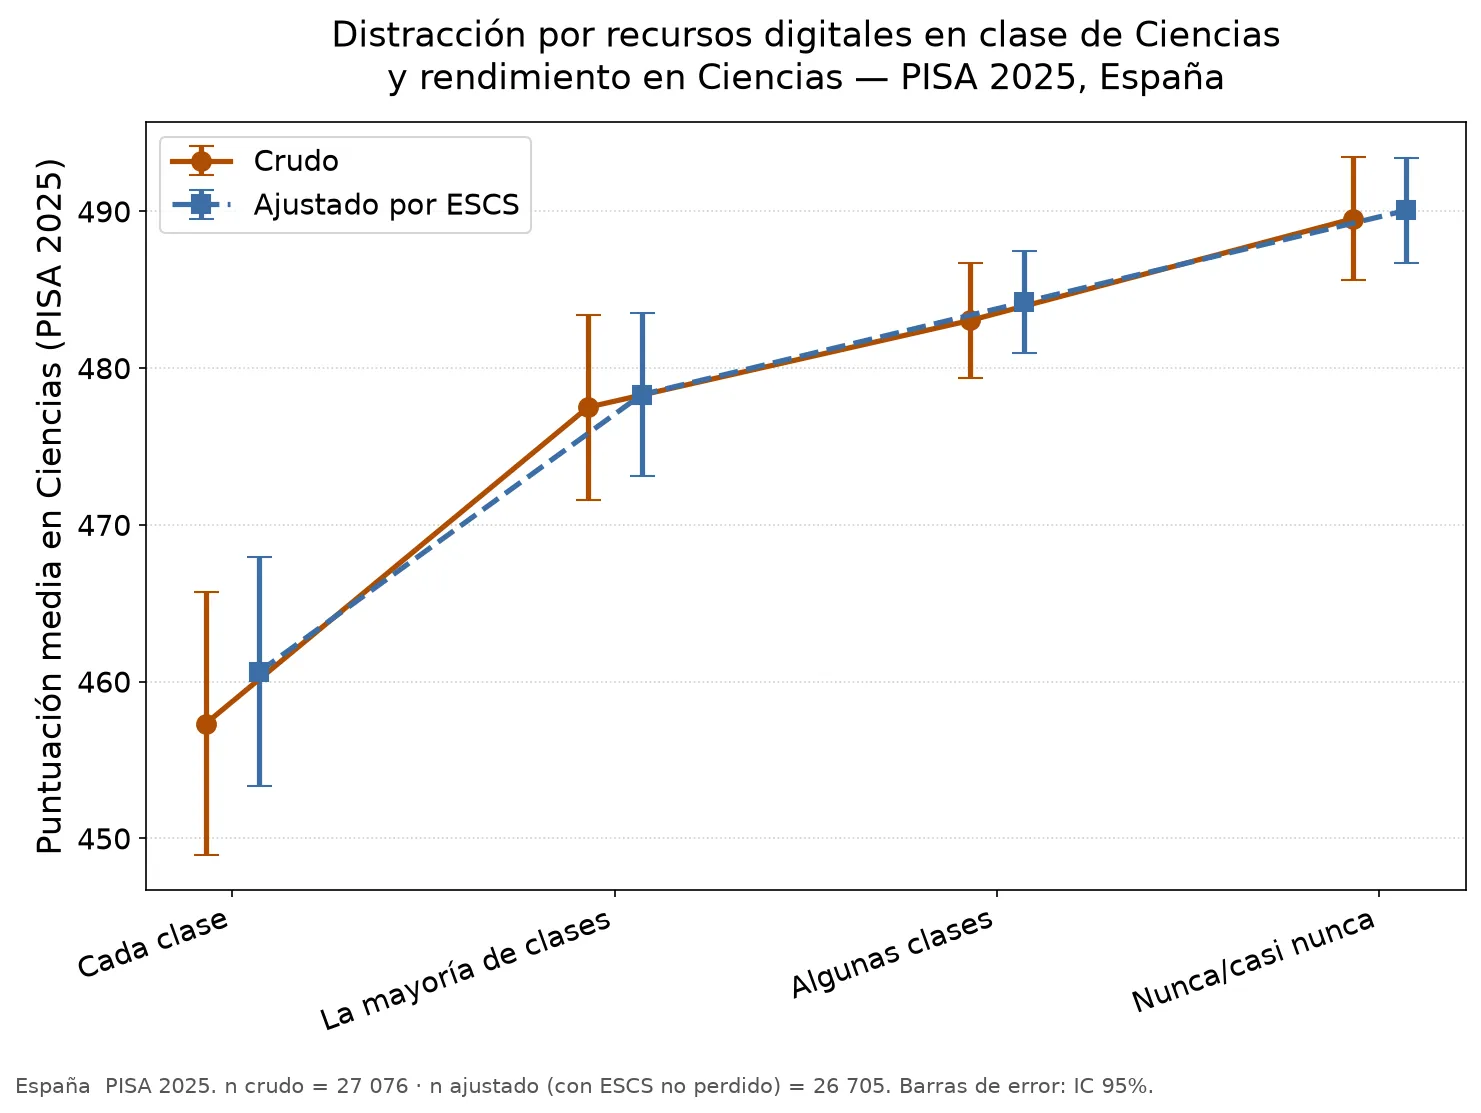
Distraction from digital resources in Science class, as perceived by students: the relationship is clear and consistent, with and without adjusting for the family’s economic-cultural status. Less perceived distraction, better score, with no exceptions.
AI chatbots don’t follow the same pattern
This is where the result departs from what I myself expected going in. For the four tasks I asked about —summarising a text, looking up information, drafting a piece of writing, “helping me learn”— the mean score doesn’t change monotonically as chatbot use frequency increases. The relationship isn’t monotonic for any of the four, but there’s no single shape that unifies them either: each task draws its own curve, so it’s worth looking at them one by one. (Overlapping confidence intervals between groups aren’t the same as a significance test, and everything that follows is descriptive, not causal — I expand on both nuances in the limitations section below.)
Summarising a text. Those who never or almost never use the chatbot for this show, of the five groups, the highest estimated mean (497.3 points raw, 501.2 adjusted). From there, the score drops with occasional use (“1-2 times a year”, 476.5), rebounds somewhat with more regular use (monthly, 488.1, and weekly, 481.6) without reaching the level of “never”, and falls to its lowest point with daily use (470.5). It isn’t a simple decline as chatbot use increases: it’s “never” at the top, a dip at occasional use, a partial rebound at monthly/weekly use, and the minimum at daily use.
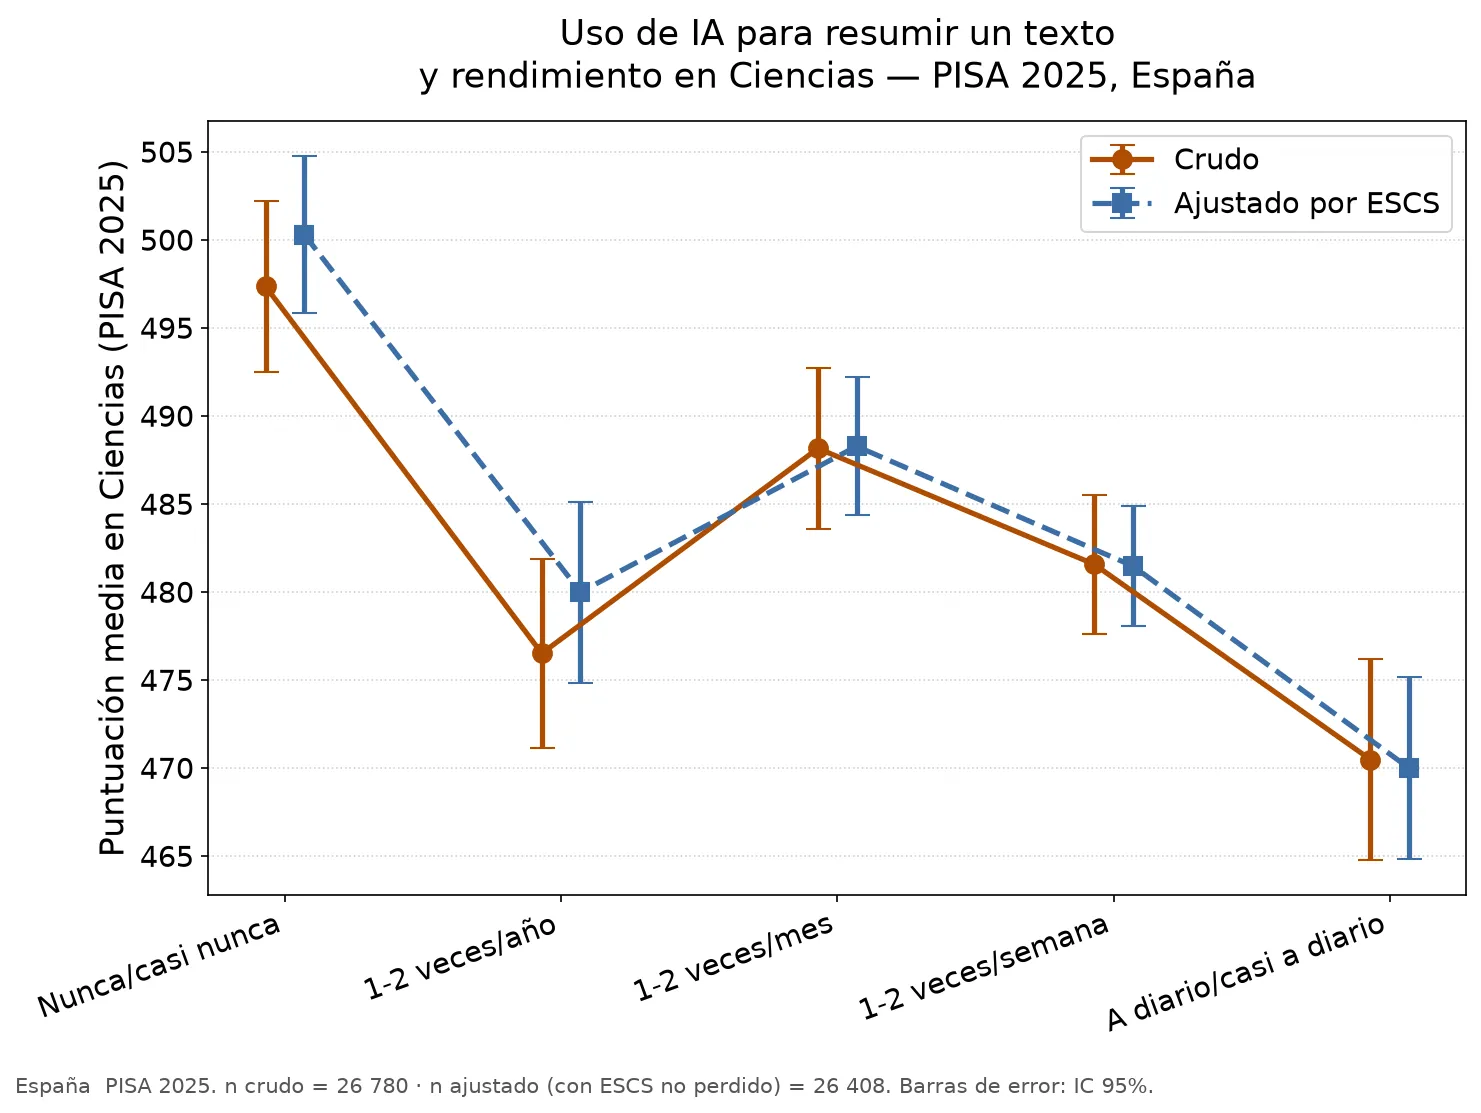
Chatbot use for summarising a text: the highest estimated mean is among those who never or almost never use it for this; the lowest, among daily users. Between the two extremes, the relationship isn’t monotonic.
Looking up information on a topic. Here the highest estimated mean isn’t among those who never use the chatbot, but among those who use it once or twice a week — that group shows, on average, a score above that of those who never use it. The lowest estimated mean, on the other hand, is at occasional use (“1-2 times a year”); with daily use the score drops relative to the weekly peak, though without falling as low as occasional use.
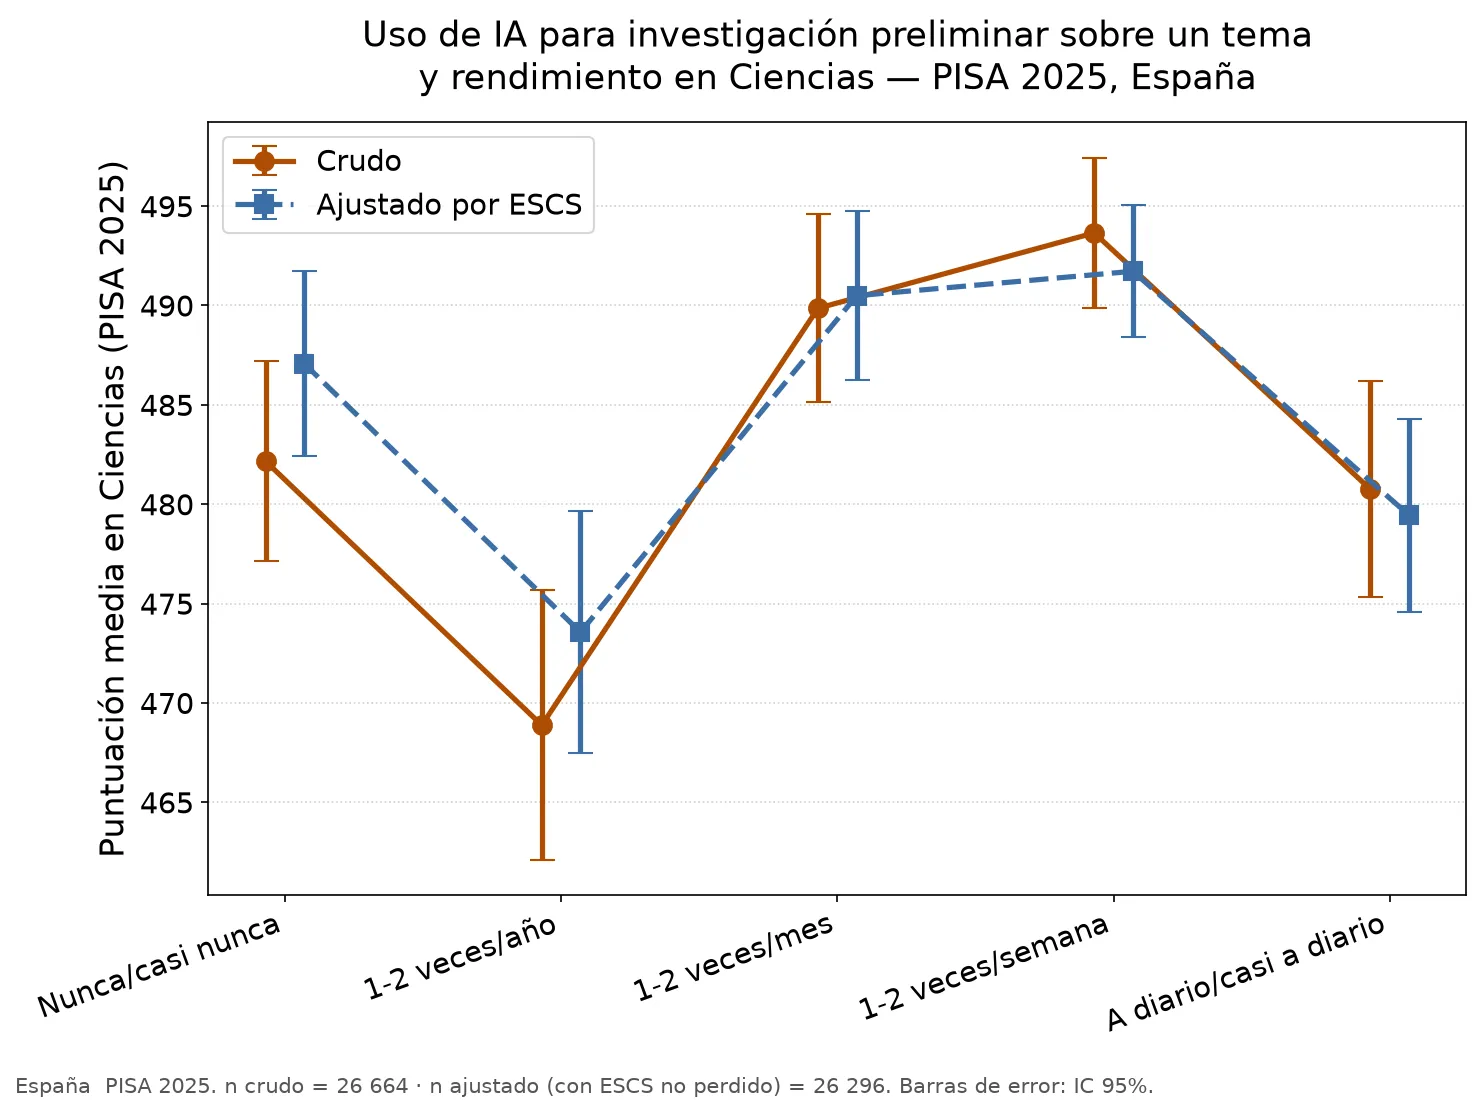
Chatbot use for looking up information: the highest estimated mean is among those who use it once or twice a week, above even those who never use it for this; the lowest is at very occasional use.
Drafting a piece of writing. Of the four, this is the task with the simplest curve: the score already drops from “never” and stays relatively stable, with small fluctuations, between occasional and weekly use, with no clear peak above “never”. Daily use has the lowest mean score of the five groups, although its confidence intervals visually overlap with those of “1-2 times/week” and “1-2 times/month” (see limitations on what that overlap does and doesn’t imply).
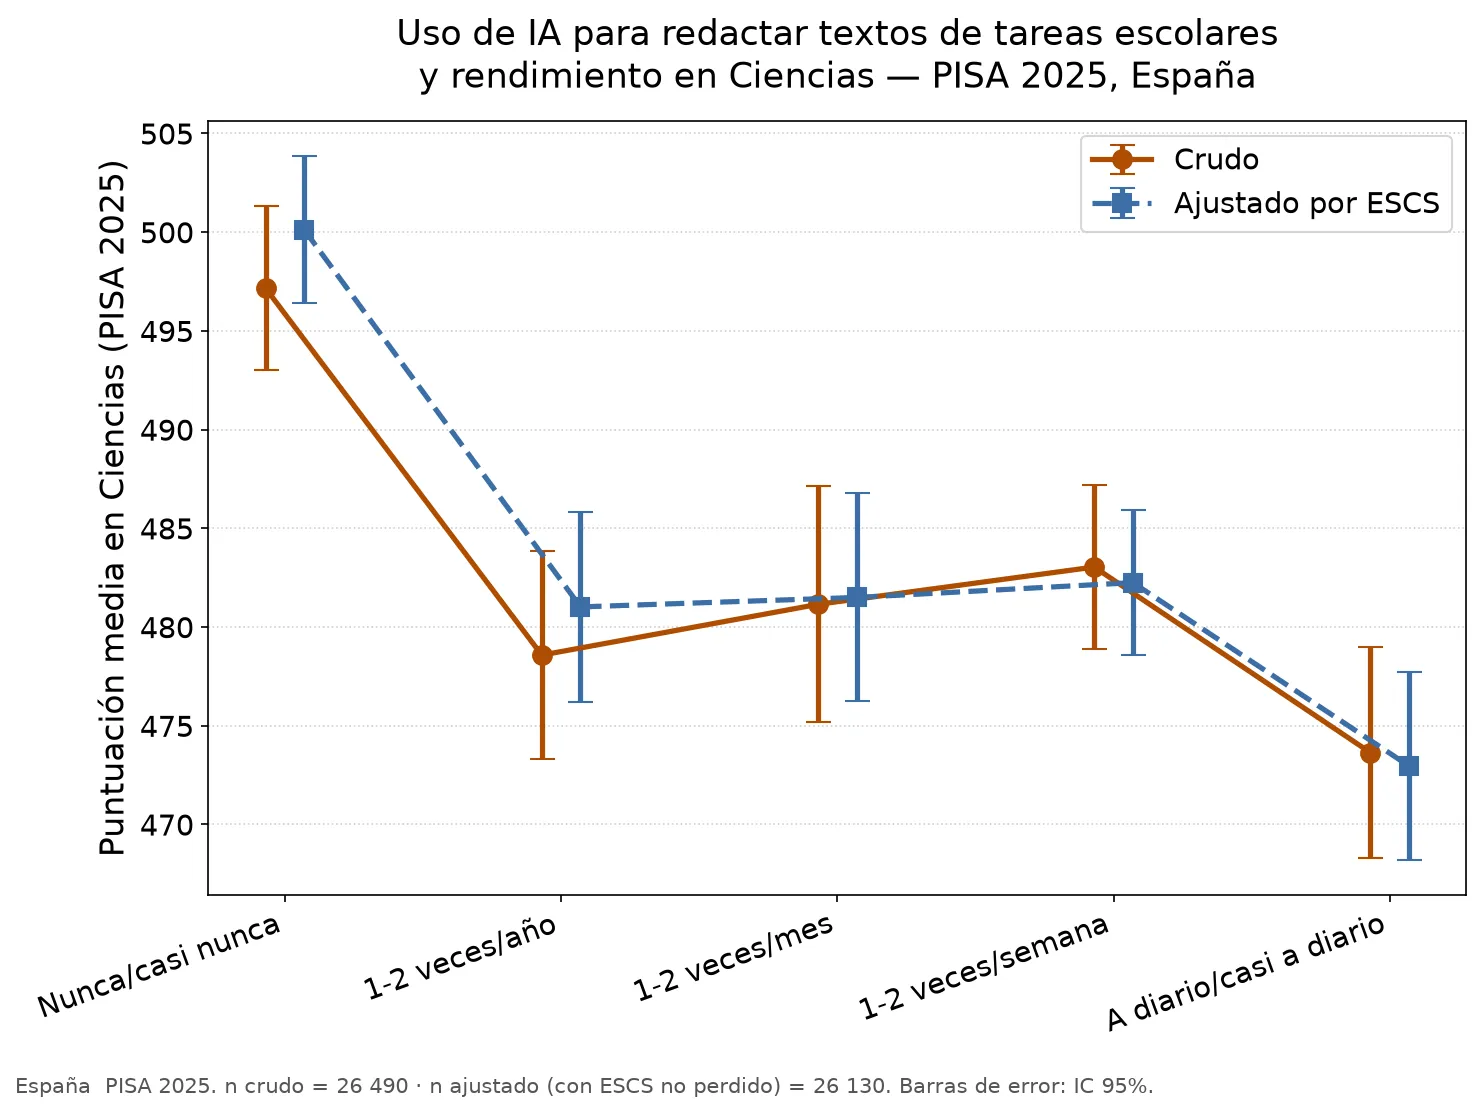
Chatbot use for drafting schoolwork: the lowest mean score is at daily use; its confidence intervals visually overlap with those of weekly and monthly use, and this analysis does not compute a direct test of that difference.
Chatbot use for “helping me learn”. This item only asks how often the chatbot is used with that stated purpose — it doesn’t ask about teacher guidance or any kind of reflection, so I treat it for what it is: one more usage frequency, not a measure of “guided” or “reflective” use. It doesn’t follow a clear line either: the lowest score is at very occasional use and the highest at weekly use, and daily use drops slightly relative to weekly. The difference between “never” and occasional use, though, has confidence intervals that visually overlap (see limitations).
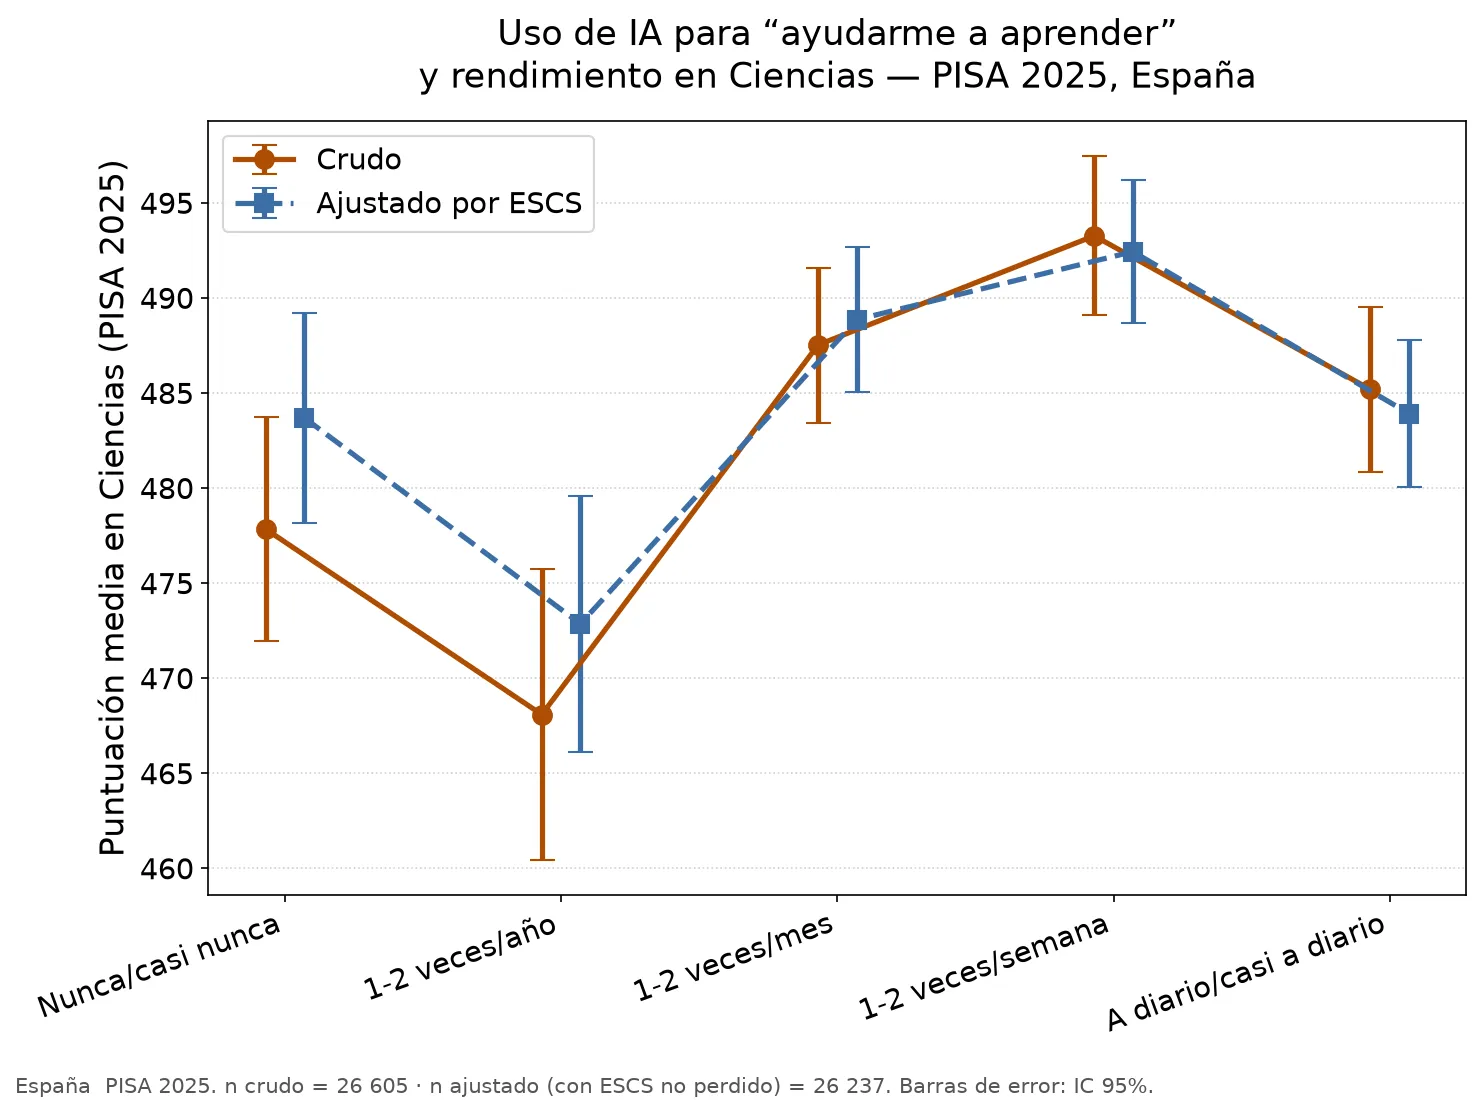
Chatbot use for “helping me learn”: this task doesn’t follow a clear line either; the peak is at weekly use.
Adjusting for ESCS shifts the estimates, but doesn’t remove the non-monotonic character of the patterns in any of the four tasks; so those differences aren’t explained solely by the socioeconomic variation this index captures. The same nuance about the adjusted sample applies here too: for AI use, the effect of excluding that ~1.4% with no ESCS data and the effect of the real adjustment are, in general, of similar magnitude — except in two very infrequent-use categories (“looking up information” and “helping me learn”), where the ESCS adjustment clearly dominates over the sample-exclusion effect.
The idea I started with, and that the data doesn’t confirm
I started this analysis expecting chatbot use to show as clear a relationship as distraction: that using it to have the machine do the work for you would hurt the score, and that using it with more judgement would protect it, in a relationship easy to draw as a single line. That’s not what I find. And there’s something just as important I have to say just as clearly: with this kind of data, taken at a single point in time, I can’t know what’s cause and what’s consequence.
There are several explanations compatible with these results, and this design doesn’t allow me to distinguish between them. For example:
- Heavy chatbot use might be a consequence of already struggling in class (the student who has more difficulties turns to the tool more), and not the cause of a lower score.
- Certain usage patterns could be a marker of study habits, digital competence or prior performance, and not their cause: a student who already knows how to study well might use the chatbot differently from one who doesn’t, without that usage pattern being the cause of the score.
With a single snapshot —without following the same students over time— I can’t rule out any of them. What the estimated means show is a non-monotonic profile whose shape depends on the task; this design doesn’t allow me to explain why.
About the “full school year” figure
The figure that opened this article —that using the chatbot “well” is equivalent to gaining a full school year compared to using it “badly”— circulates attributed to the OECD, but almost always without saying exactly where it comes from. This time I did locate the specific source: the official report PISA 2025 Results, Volume I, published by the OECD on 8 September 2026, documents that benchmark of approximately 20 points ≈ 1 year of learning in a box identified as “Box I.2.2”.
With an important precision that’s worth not glossing over: that Box I.2.2 is a general benchmark for interpreting score changes over time, between PISA cycles — not something the chapter of the report specifically dedicated to AI applies to the finding about chatbot usage frequency. The specific combination that circulates (“using AI well or badly equals a school year”) is a conversion made by secondary third-party coverage, which merges two separate parts of the report — the general benchmark on one side, the AI finding on the other —, not something the OECD states literally in those terms in its AI chapter.
I tried to recalculate that conversion myself with the public file (Public Use File) and couldn’t: the 20-point benchmark isn’t a variable missing from the 2025 PUF, it’s an independent estimate that the OECD builds with its own methodology on other data and cycles, so there’s no way to reproduce it from this single file. The figure now has a specific, locatable source, but it’s still something I haven’t verified independently with my own means —I leave the exact reference in the bibliography, with that caveat.
Limitations of this analysis
Before the conclusions, it’s worth gathering here the full limitations of the design, rather than the brief note that already accompanies each chart. This is a cross-sectional analysis: a single snapshot in time that doesn’t allow for establishing causality. Both variables come from responses students reported on the questionnaire, not from objective records: chatbot use is self-reported, while distraction captures students’ perception of their classroom climate, not a self-report of their own individual distraction. The ESCS adjustment reduces, but doesn’t eliminate, possible confounding with other variables not measured here. Several of the comparisons between usage categories (for instance, when confidence intervals overlap) are descriptive, without a direct statistical test between groups. And the results refer specifically to 15-year-old students in Spain and their Science performance — they aren’t generalisable without further evidence to other ages, countries or subjects.
What I take from this analysis
Two conclusions, neither one a comfortable headline:
- Distraction from digital resources perceived in Science class is clearly and consistently associated with lower scores, with and without adjusting for the family’s economic-cultural status. This isn’t surprising, but now I say it having checked the data myself, not repeating what someone else says.
- AI chatbot use for schoolwork tasks doesn’t follow any simple pattern — neither “the more you use it, the worse” nor “use it wisely and you’ll score better” hold up as simple rules. The estimated means show a non-monotonic profile whose shape changes by task. A longitudinal design would allow the temporal sequence to be studied more thoroughly; estimating causal effects with more solidity would require experimental or quasi-experimental designs.
I keep working with open data because I’d rather be wrong transparently —showing exactly what I compared and how— than repeat someone else’s figure I haven’t been able to verify.
Reproduce the analysis yourself
The empirical calculations in this analysis —the means, the confidence intervals, the charts— can be reproduced independently with the data and notebook below, without having to take my word for it. Two things are available to you:
The original data. The file I analysed is PISA 2025’s Student Questionnaire Data File, published by the OECD itself:
- Official PISA database page at the OECD (the OECD still hosts the 2025 cycle there, with the URL curiosity I mention above).
- Direct download of the exact file I used (SPSS format, ~1 GB, anonymous responses from over 755,000 students across 91 countries, including the 29,966 Spanish records I use here).
The notebook with the full process. I’ve published a downloadable Jupyter notebook with the complete analysis, start to finish: how to extract Spain’s subset from the OECD file, how I confirmed the data was genuinely from the 2025 cycle and not an earlier edition, the combination of the ten plausible performance values with the sampling weight and the resampling replicates (BRR-Fay), the adjustment for socioeconomic-cultural status —including the three-step comparison (raw with all cases, raw restricted to those with ESCS data, and adjusted) that I use to separate the effect of excluding the ~1.4% without ESCS from the real effect of the adjustment—, and the code that generates the five charts in this article. It’s designed so that anyone —with basic Python knowledge— can run it on the same file and check that it arrives at exactly the same figures, or adapt it to check other questions on the same dataset.
Two sibling analyses on xiringase.com
This analysis is part of a broader conversation about PISA 2025 and technology that I follow on xiringase.com, this ecosystem’s sibling brand. Two complementary pieces cover the same dataset from other angles: PISA 2025 and technology in the classroom, about devices and digital distraction in general, and PISA 2025 and AI: why the right question isn’t which chatbot you use, but how you use it, which picks up directly on this analysis’s finding —the absence of a simple pattern by task type— to ask what that means for the judgement with which AI is used in the classroom.
References
- OECD. PISA 2025 Database. Organisation for Economic Co-operation and Development.
- OECD. PISA — Programme for International Student Assessment. Official programme page.
- OECD. PISA 2025 Results (Volume I). Published 8 September 2026. Source of the approximately 20-points ≈ 1 year of learning benchmark mentioned in this article, documented in box “Box I.2.2”; not recalculated with the 2025 PUF because the benchmark comes from an independent estimate based on information from several cycles, not a variable contained in this file. Consult the PISA 2025 publications catalogue at oecd.org for the exact edition.
- OECD. PISA 2025 Results (Volume I) — Country Notes: Spain. Source of Spain’s sample exclusion rate (7.9%), the breakdown by autonomous community (Catalonia, Murcia) and the OECD’s own explicit warning about the possible upward bias that exclusion introduces.
- OECD. PISA 2025 Database — Student Questionnaire and Codebook & Compendia. Source of the exact wording and coding of items
ST097Q06DA(distraction from digital resources) andST438Q01DA–ST438Q04DA(AI chatbot use) described in this article.