Essay · Essays
The Fourier transform: from time to frequency
Why sound can be understood as a sum of frequencies, what the Fourier transform does with that idea, and how the spectrum explains tuners, equalisers, and spectrograms.
There is a mathematical idea that, once you understand it, changes how you hear. The Fourier transform makes a claim that seems impossible: any sound, however complex, can be decomposed into a sum of pure tones. A gaita note and the same note on a piano share the same fundamental frequency, but their harmonic spectrum is different — and that distribution of energy is where timbre lives. This essay is about why that is true and why it matters.
Two ways of looking at sound
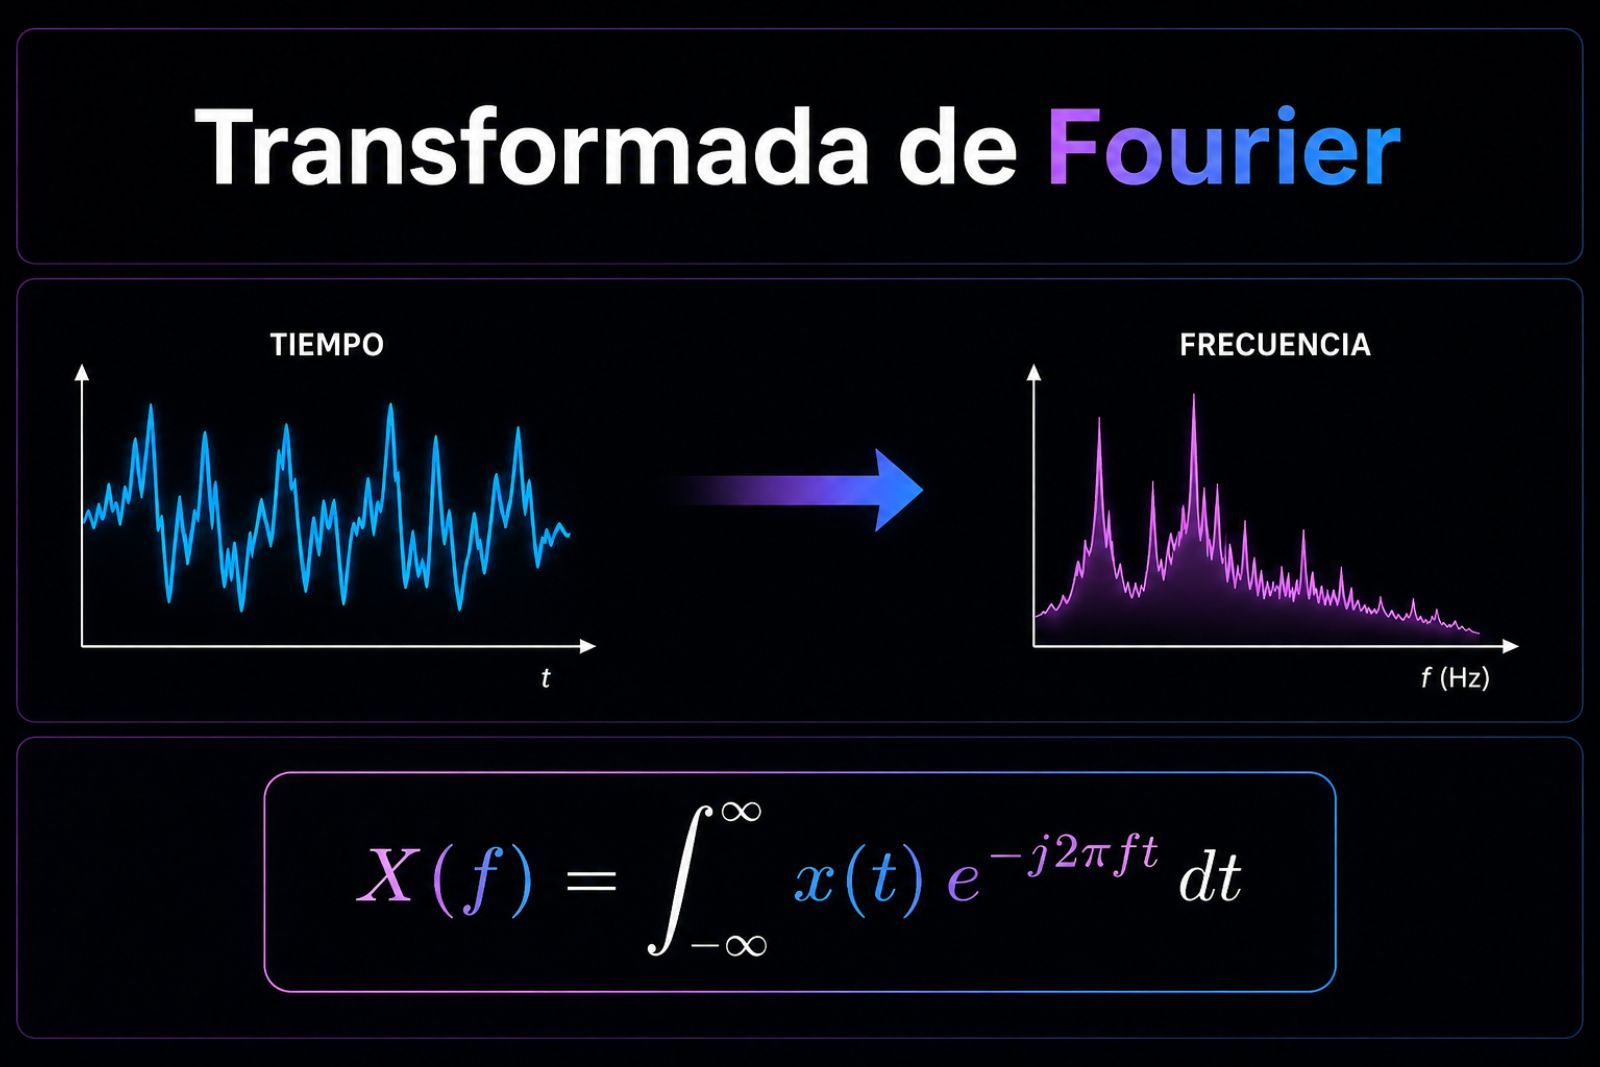
When a microphone captures sound, it records one thing: how air pressure changes over time. That is the waveform — that undulating line visible in any audio editor. It is the time-domain representation: at each instant, a single value.
The waveform is honest but not very informative. Looking at it, you can tell there is sound and how loud it is, but it does not easily tell you which notes it contains or what timbre it has. That information is there, but hidden inside the shape of the oscillations.
The Fourier transform offers the other view: the frequency-domain representation. Instead of “what value at each instant,” it answers “how much energy is present at each frequency.” It is the same sound seen from a different angle.
The underlying intuition
The core of the idea, put forward by Joseph Fourier in the early nineteenth century, is this: any periodic signal can be written as a sum of simple waves — sines and cosines — of different frequencies and amplitudes. Change the “recipe” — which frequencies, in what proportion — and you change the sound.
The transform does the reverse: it starts from the mixed sound and recovers the recipe. You hand it the waveform and it gives you back the list of frequencies present and their relative weight. That list is the spectrum. What allows you to recognise an instrument even without seeing who is playing lives there: in the distribution of energy across frequencies.
From the blackboard to the computer
The version computers use is the Fast Fourier Transform, the FFT: an algorithm that computes the spectrum of an audio segment efficiently. Without that efficiency, much of everyday digital audio would not be possible. With it, the computation fits easily on any device.
And it appears, almost always without us noticing, in everyday tools:
| Tool | What it does with the FFT |
|---|---|
| Tuner | Measures the fundamental frequency and calculates the tuning deviation |
| Equaliser | Separates frequency bands to raise or lower them independently |
| Spectrogram | Draws the spectrum frame by frame: Y axis = frequencies, colour = energy |
| Automatic transcription (AMT) | Detects notes from energy peaks in the spectrum |
Why I bring it up here
I place the Fourier transform in the essays section, not in a tutorial, on purpose. It is not a recipe: it is one of the foundational ideas underlying almost everything done when music computing leaves the symbolic level — the level of notes and MIDI — and enters real sound, the signal level.
Playing an instrument is producing a spectrum that changes over time. That mathematics can read it — moving from time to frequency and back — is what allows us to analyse it, transform it, and sometimes understand it better. You do not need to compute an FFT by hand for it to change how you listen; it is enough to know that beneath every sound, there are frequencies waiting to be counted.